
Intro
A guide to effectively utilizing a flowchart in software testing. But first, let’s give you some context on what software testing is and why quality matters. Software testing is a critical part of the software development process. It ensures that the software performs as intended and meets the end-users requirements. Testing involves various activities, including planning, designing, executing, and evaluating tests. Among these, test design is a crucial activity that determines the test cases’ effectiveness in identifying defects. Test design(or writing test cases) involves several techniques and tools to create high-quality and efficient test cases. One such tool is a flowchart or a flow diagram. In this post, I’ll explain how a flowchart in software testing can be effectively utilized.
Flowchart in software testing
A flowchart in software testing is a graphical representation of a process or system’s workflow that shows the sequence of actions involved in achieving a specific goal. In software testing, flowcharts are useful for extracting test cases out of a workflow that is easy to understand, execute, and maintain. This post explores the use of flowcharts in software testing, their benefits, and how to create them.
Flowcharts are an essential part of software testing as they help to visualize the flow of how to application works and identify potential errors early. A flowchart is a graphical representation of a process or system that uses symbols, actions, and arrows to show the sequence of actions. It is a powerful tool that helps to understand complex systems, identify bottlenecks, and streamline processes. In software testing, flowcharts are used to plan, design, and execute test cases.
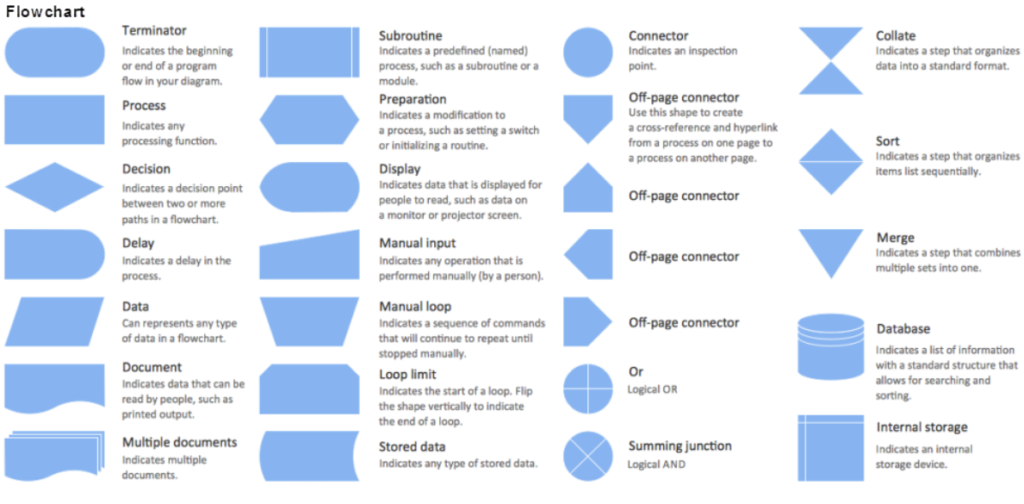
The most common symbols used in flowcharts are rectangles, diamonds, ovals, and arrows. Each symbol has a specific meaning and is used to depict a specific action or decision in the process. For example, a rectangle represents a process or action, a diamond represents a decision, an oval represents the start or end of a process, and an arrow represents the flow of the process from one step to another. Check out all of the symbols a flowchart can have.
Benefits of Using Flowcharts in Software Testing
- Flowcharts in software testing are simple and easy to understand, even for non-technical individuals. Test cases created using flowcharts are straightforward and easy to follow, enabling developers, testers, and others to understand the flow easily and identify defects quickly.
- By using flowcharts, testers can create effective test cases, as they enable the identification of various scenarios, including exceptions and alternative paths, which leads to comprehensive testing coverage.
- Any changes in the software’s functionality can be easily reflected and updated in the flowchart.
- They help in identifying potential risks in the SDLC, ensuring better collaboration and communication between team members.

How to Create a Flowchart for Software Testing
Creating a flowchart involves several steps, including identifying the process or system to be tested, determining the test conditions, and creating the flowchart diagram. Here is a step-by-step guide to creating a flowchart for software testing:
Step 1: Identify the Process or System to be Tested
To begin testing, the initial task is to pinpoint the process or system that requires evaluation. This system could be a standalone application, a web-based application, or a mobile application. Once the system has been determined, the next step is to identify the software’s functionality that needs to be tested, which encompasses its inputs, outputs, and dependencies.
Step 2: Determine the Test Conditions
Once the system’s functionality has been identified, the next step is to establish the test conditions that require evaluation. These test conditions refer to specific inputs and outputs that the system should produce. To ensure comprehensive testing, these conditions should encompass all possible scenarios, including both positive and negative test cases, and should be based on the software’s requirements.
Step 3: Create the Flowchart Diagram
The next step is to create the flowchart in software testing diagram. The flowchart should describe the steps involved in testing the system, including the test conditions, expected outputs, alternate paths, decisions, etc.
One great tool for creating flowcharts is diagrams.net. Check it out! Here is an example of a flowchart for testing 2 kinds of processes using the :
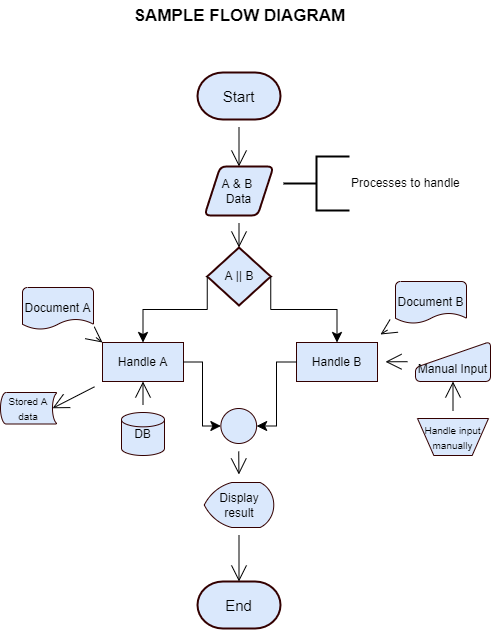
In this example, you can see that the oval shape is the start of the flow. Then we have the squircle which represents data to handle and can be processed A and B. Going down the flow we have the decision to make, whether to handle process A or B. Let’s say we handle process B. In that case, the rectangle is the actual handling of that process by some guide(which can be a form of a document) and then some manual input required by an engineer or a responsible one who is part of handling the process.
Both directions lead to a connector(circle symbol) which then displays the results and ends the process. This is a very basic diagram and we can easily extract test cases from it for both of the processes including positive and negative flows. The flowchart in software testing can also include alternate paths where the process ends abruptly or is intended to end based on a condition.
Step 4: Create Test Cases
After creating the flowchart, the next step is to create test cases based on the flowchart diagram.
| Test Case | Preconditions | Steps | Expected Result |
| Successfully handle process A | Database installed; Document prepared | 1. Start the process 2. Choose process A 3. Handle process A with the help of the database and documentation and store the result 4. Display the results | Successfully handles process A and results displayed |
| Successfully handle process B | Document prepared; Knowledge of manual input acquired | 1. Start the process 2. Choose process B 3. Handle process B with the help of the documentation and the manual input from an engineer 4. Display the results | Successfully handles process B and results displayed |
| Process A ends abruptly | No database installed | 1. Start the process 2. Choose process A 3. Try to handle process A with no database installed 4. Check the outcome | Process A ends abruptly due to the database not being installed |
You can create your test automation strategy by having all of the test cases extracted and created with the help of the flowchart. I hope that this post helped in understanding the importance of a flowchart in software testing.